MONITORING THE IMPACT OF COVID-19:
Q4 2020 AUTO TRACKER
This November 2020 AUTO COVID-19 Tracker focuses exclusively on our auto loan and lease data. Auto securitisations tend to report monthly, which makes it possible to follow the chronological impact of the crisis on the loans more precisely.
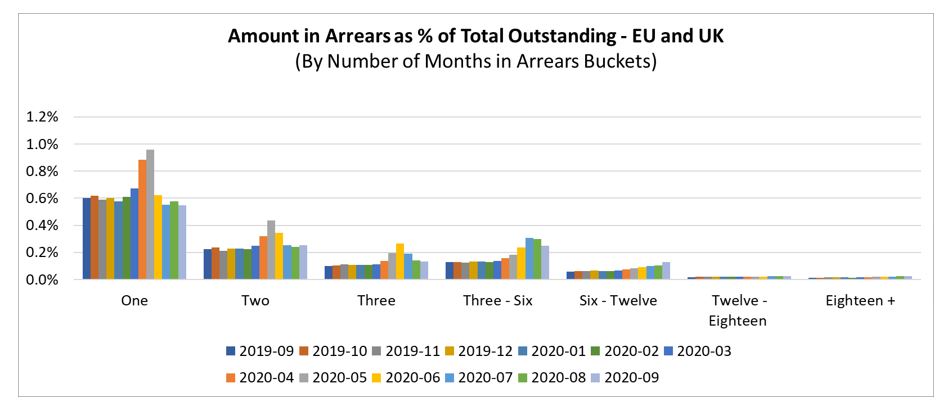
In terms of delinquencies, the impact of the crisis on auto loans is visible in all countries, with a surge in delinquencies in March 2020, followed by a peak in May that generally stabilised or receded somewhat afterwards, to above pre-crisis levels.
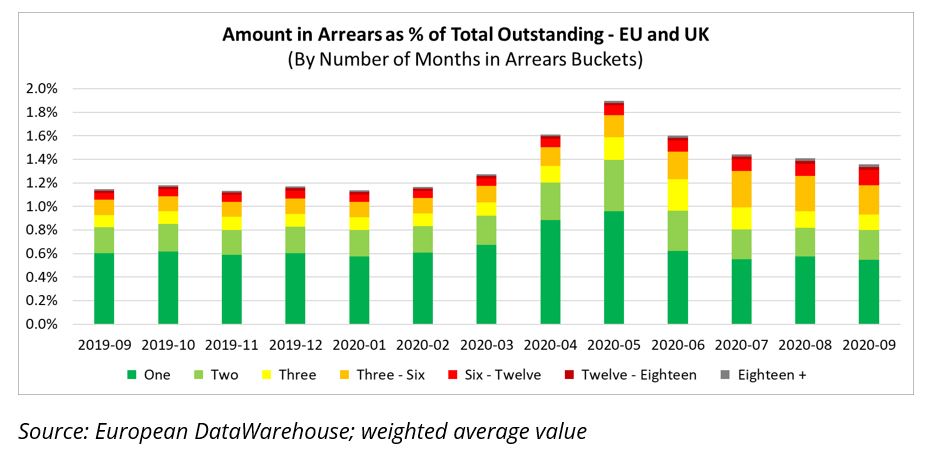
Our “Auto Arrears” tabs, organized by country, focus on arrears and show the evolution of arrears by arrears buckets, and often show a ripple effect, starting in March/April 2020. The column “one” month in arrears increased first, and the column “two” months in arrears reacted just a month later etc. The data selected for these charts include the deals that were active throughout this crisis (adding a deal in between would artificially lower observed delinquency levels given that all loans are supposed to be performing at the time of securitisation).
It is striking however, that the delinquency peak looks moderate and short-lived given the severity of the crisis. As is the case in other markets, auto loans were often modified to avoid default. Specific flags are available to identify the modified loans (see our blog Special Reporting Guidelines: How to Report Data to Reflect Covid-19) but these were not always used, and we therefore had to use other criteria to identify modified loans. Modified loans are loans where the repayment schedule was at least temporarily modified to make repayment lower or zero for a while (a so called “payment holiday”). This kind of change usually materialises in three main ways 1) The maturity of the loan is postponed and/or 2) the monthly instalment is brought to zero or reduced (we selected a 50% reduction at least in instalment amount) and/or 3) the arrears or unpaid amounts are capitalised which results in an increase in the loan amount after modification. If we had used another definition, for instance a decrease of 30% at least of the instalment amount and a loan amount that stops amortising, we would have found higher levels of loan modifications. Had we only looked for loans where the amount due had been reduced to zero, we would have found lower amounts of loan modifications.
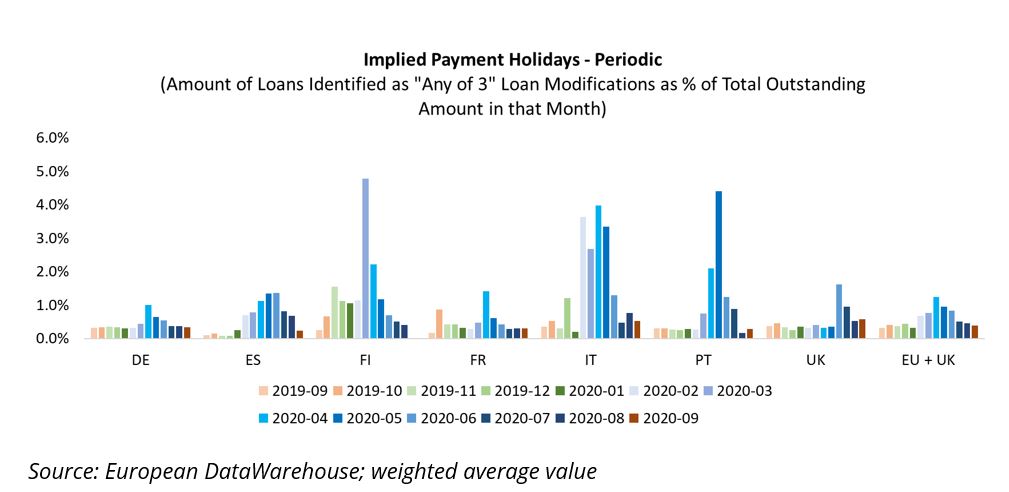
Periodic loan modifications peaked in April/May 2020 and decreased over the summer. It is important to note that loan modifications were already happening, although at lower levels, in most countries, prior to March 2020. As of September 2020, loan modifications were trending back towards pre-crisis levels (see “Statistics by Country” tab).
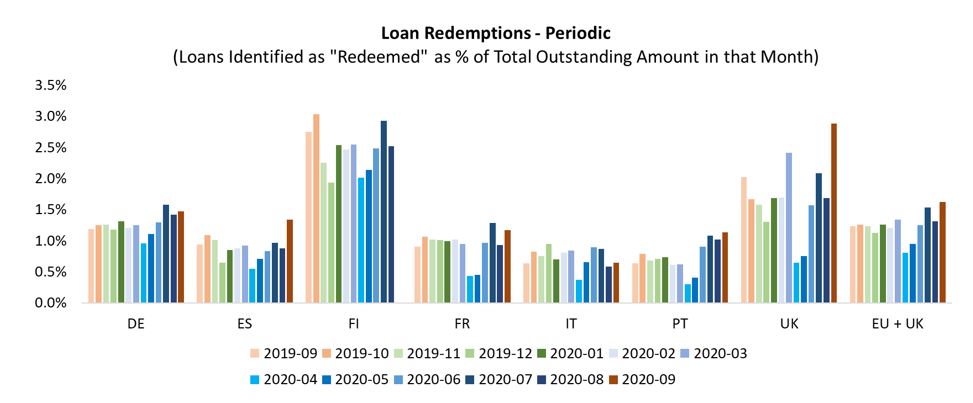
Looking at loan redemptions, we note also that periodic loan redemptions have typically been higher than loan modifications. It is striking, that loan redemptions dropped to their lowest levels during April/May 2020 before trending back to pre-crisis levels; as more loans were being modified, fewer loans were being redeemed.
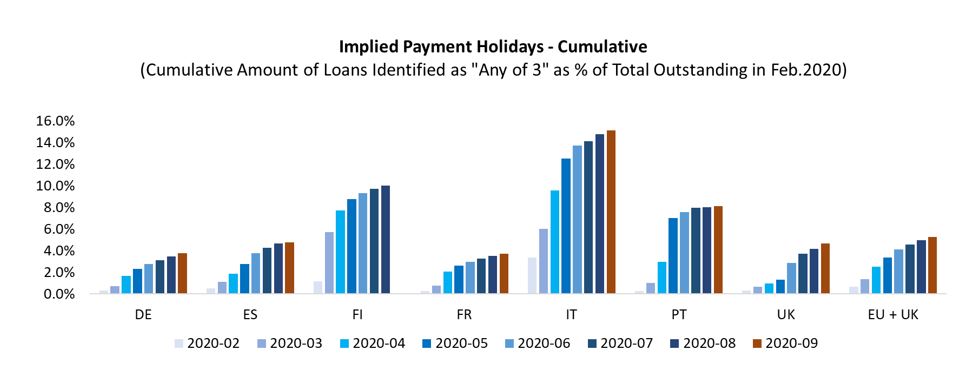
Overall, we find that cumulative payment holidays for EU + UK tend to be in the 4-5% range as of end of Q3 2020, ranging from 3.7% for Germany to 15.1% in Italy.
In the Excel version of our COVID Tracker, the data is presented on a country by country basis, with one tab for arrears-related statistics, and another tab focusing on loan status and modifications. In the “Loan Modifications” tabs, Table A and Table B show the stratification of the outstanding amounts by loan status. Delinquencies and defaults in these tables do not always match the values in our “Arrears” tabs, because the two samples do not completely overlap (in the arrears tab we select only the deals that have been active throughout the crisis whereas for the ” Modifications” tabs we use all deals that reported data in March 2020).
In the ” Modifications” tabs, Table C (amount) and Table E (percentage) focus on the periodic loan modifications and table D and F show the cumulative loan modifications. We track first loan modifications only, but we know that some loans were modified several times already. The category “Any of 3” refers to any of the three-loan modification/payment holiday flags being hit for the first time since the beginning of the COVID-19 crisis.
Table H shows the number of deals available in every month and the outstanding amount of loans that were taken into consideration.
Please do not hesitate to contact us at enquiries@eurodw.eu if you have questions.
European DataWarehouse GmbH’s research team produces a number of annual indices and special research reports to highlight current trends in European the asset-backed security (ABS) market. The data set includes more than 2.5 billion loan-level data points from commercial mortgage-backed securities (CMBS), residential mortgage-backed securities (RMBS), small business loans, auto loans, consumer finance, credit cards and other ABS transactions.
Users can access the data on the ABS platform with European DataWarehouse’s cloud-based solutions EDITOR and EDVANCE, or a standard API interface, and analyse and compare underlying portfolios.
Data used in this research is uploaded by ABS issuers to comply with European Securities and Markets Authority (ESMA) and European Central Bank (ECB) regulatory requirements for asset-backed securitisation transactions, as well as Bank of England loan-level data requirements.
For custom research reports or information on how to access the loan-level data yourself, please contact us at enquiries@eurodw.eu. Furthermore, if you have conducted research with our ABS data and would like us to feature it, please email us.